

1. 코드
fig, ax = plt.subplots(nrows = 1, ncols = 2, figsize = (16, 5))
ax0 = sns.barplot(x = 'day',      # x축
            y = 'total_bill',     # y축
            data = tips,          # 데이터
            errorbar = None,      # ?
            color = 'lightgray',  # 색
            alpha = 0.85,         # 투명도
            ax = ax[0]
            )

plt.show()x축은 tips 데이터의 day
y축은 tips 데이터의 total_bill
데이터는 tips
errorbar는 None
color는 lightgray
aplha = 0.85
ax = ax[0]
2. Seaborn 홈페이지 errorbar
errorbar : string, (string, number) tuple, callable or None
Name of errorbar method (either “ci”, “pi”, “se”, or “sd”), or a tuple with a method name and a level parameter, or a function that maps from a vector to a (min, max) interval, or None to hide errorbar.
errorbar는 데이터 값이 신뢰 구간을 포함하는지 여부를 시각적으로 보여주는데 사용됩니다.
일반적으로 데이터를 표시하는 마커와 함께 사용됩니다.
- ci : 신뢰 구간(confidence interval) 기반의 에러바를 그립니다. 이때 신뢰 구간의 크기는 conf_intervals 인자를 통해 설정할 수 있습니다.
- pi : 예측 구간(prediction interval) 기반의 에러바를 그립니다. 이때 예측 구간의 크기는 conf_intervals 인자를 통해 설정할 수 있습니다.
- se : 표준 오차(standard error) 기반의 에러바를 그립니다.
- sd : 표준 편차(standard deviation) 기반의 에러바를 그립니다.
- (method, level) : (method, level) 튜플을 사용하여 에러바 스타일을 지정할 수 있습니다. method는 위의 ci, pi, se, sd 4개 중 하나를 선택하고 level은 신뢰 구간의 크기를 나타내는 실수값입니다.
- callable : callable 객체를 사용하여 벡터를 받아 (min, max)형태의 에러바 크기를 반환하는 함수를 지정할 수 있습니다.
- None : 에러바를 숨길 때 사용합니다.
3. 출력 예시
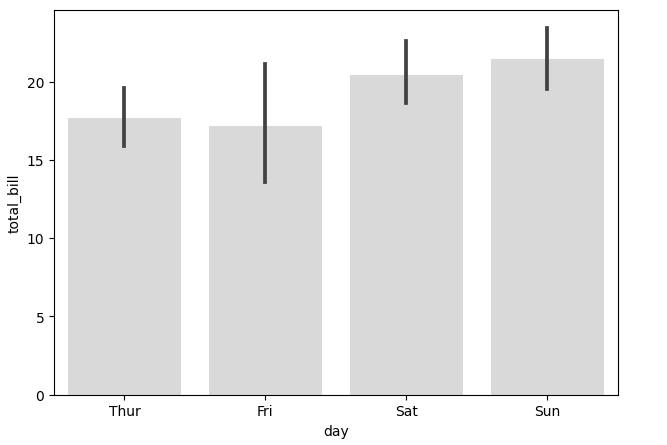
bar plot 위에 나타나는 선이 error bar 입니다.
'Python > Study' 카테고리의 다른 글
| [Python / Study] 데이터 전처리 연습하기 (0) | 2023.04.19 |
|---|---|
| [Python / Study] plotly 사용하여 시각화 연습 (3) (0) | 2023.04.17 |
| [Python / Study] plotly 사용하여 시각화 연습 (2) (1) | 2023.04.17 |
| [Python / Study] plotly 사용하여 시각화 연습 (1) (0) | 2023.04.17 |
| [Python / Study] Seaborn tips 내장 데이터를 이용해 시각화하기 (0) | 2023.04.16 |