

1. 라이브러리 설치 및 버전 확인
- 코드
import plotly
print(plotly.__version__)ploty 라이브러리를 설치한 다음에 버전을 확인합니다.
버전은 5.13.1 버전입니다.
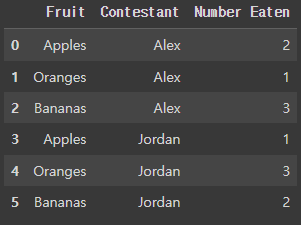
2. 데이터프레임 생성
- 코드
import pandas as pd

df = pd.DataFrame({
  "Fruit": ["Apples", "Oranges", "Bananas", "Apples", "Oranges", "Bananas"],
  "Contestant": ["Alex", "Alex", "Alex", "Jordan", "Jordan", "Jordan"],
  "Number Eaten": [2, 1, 3, 1, 3, 2],
})pandas 설치 후 데이터 프레임을 생성합니다.
- 출력
3. plotly.graph_objects 이용한 시각화
- 코드
import plotly.graph_objects as go # 그래프를 생성하는 코드
fig = go.Figure() # 새로운 Figure 객체 생성
for contestant, group in df.groupby('Contestant'): # Contestant 컬럼으로 그룹화한 뒤 각 그룹 반복문 실행, contestant 변수 = contestant, group = 현재 그룹
  fig.add_trace(go.Bar(x = group['Fruit'], y = group['Number Eaten'], # go.Bar() 막대 그래프 생성
                       name = contestant,
                       hovertemplate = "Contestant=%s<br>Fruit=%%{x}<br>Number Eaten=%%{y}<extra></extra>"% contestant)) # 해당 그래프를 마우스로 가리켰을 때 표시될 정보 지정, extra : 마우스 호버 시 표시될 추가 정보 지정

fig.update_layout(title = 'graph_objects Plot', legend_title_text = 'Contestant') # 제목, 범례 제목
fig.update_xaxes(title_text = 'Fruit') # x-label
fig.update_yaxes(title_text = 'Number Eaten') # y-label

fig.show()plotly.graph_objects로 go로 별칭을 부여합니다.
이후 반복문을 사용하여 막대 그래프를 생성하고 제목, 범례 제목, x축 제목, y축 제목을 부여합니다.
그리고 시각화합니다
- 출력
.

시각화 한 모습입니다.
4. plotly.express 이용한 시각화
- 코드
import plotly.express as px
fig = px.bar(df, x = 'Fruit', y = 'Number Eaten',
             color = 'Contestant', barmode = 'group', text_auto = True) # text_auto : 자동 텍스트 부여

fig.update_layout(title = 'Express Chart')
fig.show()plotly.express 라이브러리를 px 별칭을 부여합니다.
그리고 x축엔 'Fruit', y축엔 'Number Eaten'을 설정하고 color는 'contestant', barmode는 'group'으로 설정합니다.
text_auto는 True로 설정합니다.
제목을 Express Chart로 저장하고 시각화힙낟.
- 출력 group
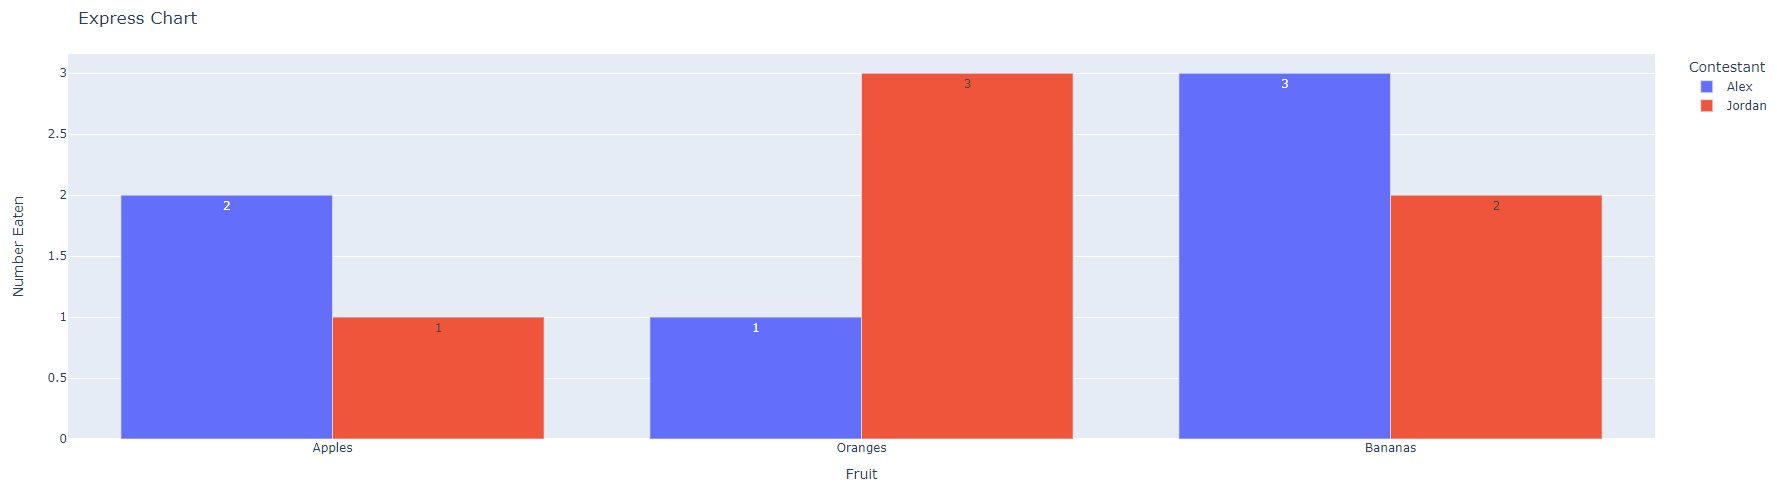
barmode가 group으로 시각화한 모습입니다.
- 출력 stack

barmode를 stack으로 설정하고 시각화 한 모습입니다.
지금까지 plotly를 이용하여 시각화를 해봤습니다.
제가 공부하는 과정을 기록하는 글입니다.
'Python > Study' 카테고리의 다른 글
| [Python / Study] 데이터 전처리 연습하기 (0) | 2023.04.19 |
|---|---|
| [Python / Study] plotly 사용하여 시각화 연습 (3) (0) | 2023.04.17 |
| [Python / Study] plotly 사용하여 시각화 연습 (2) (1) | 2023.04.17 |
| [Python / Study] Seaborn Barplot Errorbar Parameter (0) | 2023.04.17 |
| [Python / Study] Seaborn tips 내장 데이터를 이용해 시각화하기 (0) | 2023.04.16 |